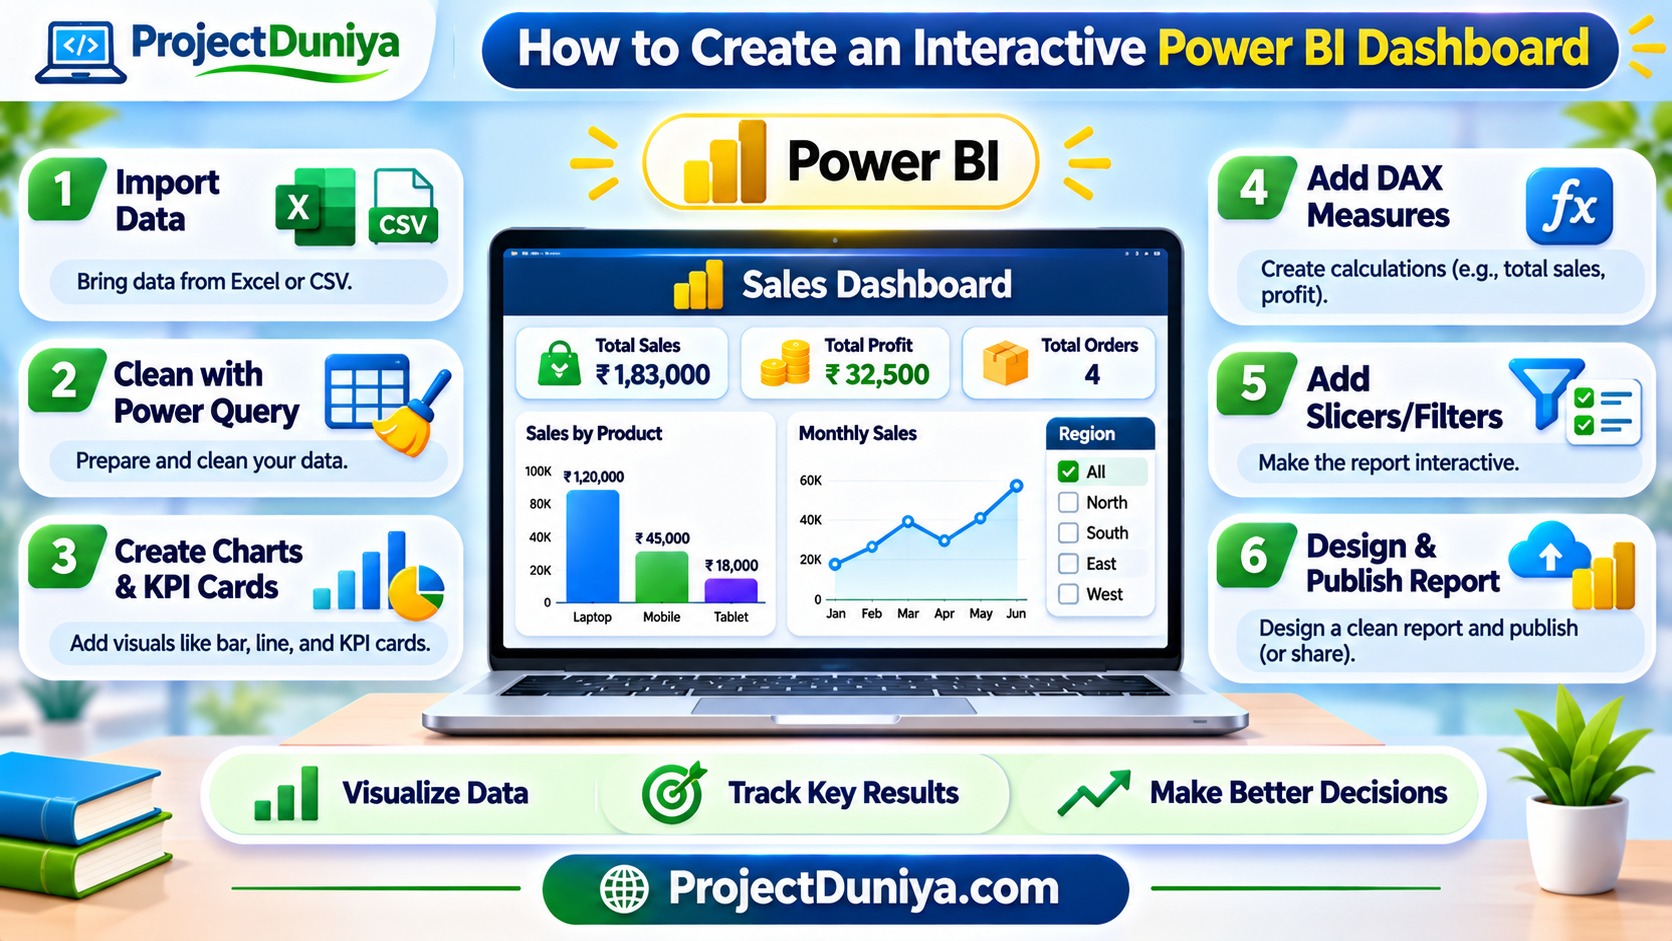
Learning how to create an interactive Power BI dashboard is a valuable skill for students, beginners, and aspiring data analysts. Instead of presenting information through long spreadsheets, you can use charts, tables, filters, and visual indicators to make data easier to understand.
Microsoft Power BI is a business intelligence tool that helps users connect, organize, analyze, and visualize data. You can use it to create reports for academic projects, business analysis, sales tracking, and many other purposes.
In this beginner-friendly guide, you will learn how to build your first interactive Power BI report step by step using a simple sales dataset.
1. What Is a Power BI Dashboard?
A Power BI dashboard provides a visual overview of important information. It helps users understand key results without manually checking hundreds of spreadsheet rows.
For example, a sales dashboard might display:
- Total sales and total profit.
- Monthly sales performance.
- Best-selling products.
- Sales performance by region.
- Changes in business performance over time.
2. What You Need Before Starting
You do not need advanced programming knowledge to create your first Power BI report. However, understanding basic spreadsheet concepts will make the process easier.
Prepare the following before starting:
- Power BI Desktop: Microsoft’s desktop application for building reports and data models.
- Sample dataset: An Excel or CSV file containing information you want to analyze.
- Basic Excel knowledge: Understanding rows, columns, tables, and simple calculations.
- A project objective: Decide what questions your dashboard should answer.
Power BI Desktop is available as a free application for Windows. Some online publishing and sharing features require an appropriate Power BI license.
3. Choose a Dataset for Your Dashboard
Your dataset determines what information you can display. For your first project, use a small sales dataset with columns such as order date, product, region, quantity, and sales amount.
Here is an example of the data structure:
| Order ID | Product | Region | Quantity | Sales |
|---|---|---|---|---|
| 101 | Laptop | North | 2 | 80000 |
| 102 | Mobile | South | 3 | 45000 |
| 103 | Tablet | East | 1 | 18000 |
| 104 | Laptop | West | 1 | 40000 |
You can create your own practice dataset in Excel or download a suitable sample dataset. Make sure the column names are meaningful and the values are organized consistently.
4. Import Data into Power BI
After preparing your dataset, open Power BI Desktop and follow these steps:
- Open Power BI Desktop.
- Select Get Data from the Home tab.
- Choose Excel Workbook or Text/CSV, depending on your file.
- Locate and select your dataset.
- Review the available tables in the Navigator window.
- Select the required table and choose Load.
Your dataset will now appear in the Data pane. You can use its columns to create charts, tables, and other report elements.
5. Clean Your Data Using Power Query
Data cleaning is an important step because incorrect or inconsistent information can affect your analysis. Power Query helps you prepare data before using it in a report.
To open Power Query Editor, select Transform Data from the Home tab.
Check your dataset for these common problems:
- Empty rows and unnecessary columns.
- Duplicate records.
- Incorrect date formats.
- Numbers stored as text.
- Inconsistent product or region names.
- Missing or invalid values.
For example, if a region is written as “North” in some rows and “N” in others, standardize the values so your charts do not treat them as separate regions.
After cleaning the information, select Close & Apply to load the updated data into Power BI.
6. Create Your First Dashboard Visuals
Now you can start designing your report. Open Report view and select an empty area of the report canvas. Choose a visual from the Visualizations pane and add the required fields.
Useful visuals for beginners
- Card: Displays a single important value, such as total sales.
- Bar chart: Compares sales across different products or regions.
- Line chart: Shows changes in sales over time.
- Pie or donut chart: Shows how categories contribute to a total.
- Table: Displays detailed records in rows and columns.
For a simple sales report, start with three card visuals showing total sales, total orders, and total quantity. Add a bar chart for product performance and a line chart for monthly sales trends.
7. Add Basic DAX Measures
DAX stands for Data Analysis Expressions. It is a formula language used in Power BI to create calculations and measures.
For example, you can create a measure to calculate total sales.
If your table is named Sales and the amount column is also named Sales, the formula calculates the sum of all sales values.
You can create another measure to count orders:
And a measure to calculate the total quantity:
To create a measure, select your table in the Data pane, choose New Measure, and enter the formula in the formula bar. Replace the example table and column names with the names in your own dataset.
8. Make Your Report Interactive with Slicers
Interactivity allows users to explore information instead of only viewing fixed charts. One of the easiest ways to add interactivity is by using slicers.
A slicer is a visual filter that allows users to select specific values, such as a year, product, or region.
To add a slicer:
- Select an empty area of the report canvas.
- Choose the Slicer visual.
- Drag the Region field into the slicer.
- Resize and position the slicer.
- Test it by selecting different regions.
You can also create slicers for order dates and product categories. Your other visuals can respond to these selections when their interactions and data relationships are configured correctly.
9. Improve Your Dashboard Design
A useful dashboard should be easy to read. Adding too many charts, colors, and labels can make your report confusing.
Follow these design recommendations:
- Place important KPI cards near the top of the report.
- Use clear titles for every chart.
- Choose a consistent color theme.
- Avoid unnecessary visual elements.
- Keep related charts close to each other.
- Use readable fonts and appropriate spacing.
- Check that filters work as expected.
Think about the person who will use your dashboard. A student project dashboard should explain its purpose clearly, while a business dashboard should make important performance information easy to find.
10. Publish and Share Your Power BI Report
Once your report is ready, save the Power BI file using the PBIX format. You can then publish it to the Power BI Service if your account and license support the required functionality.
- Save your report in Power BI Desktop.
- Select Publish from the Home tab.
- Sign in when prompted.
- Choose an available workspace.
- Open the published report in the Power BI Service.
- Where supported, pin important report visuals to a dashboard.
Remember that publishing a report and sharing it with other people are different activities. Sharing generally requires appropriate licensing and workspace permissions. Review your organization’s or institution’s access requirements before distributing a report.
11. Turn Your Dashboard into a Student Portfolio Project
After completing your first dashboard, you can improve it and use it as a practical portfolio project.
Here are some ideas for your next Power BI projects:
- Student Performance Dashboard: Analyze marks, attendance, and subject-wise performance.
- Personal Expense Dashboard: Track monthly spending and savings.
- Sales Analysis Dashboard: Compare products, regions, and monthly revenue.
- Placement Analysis Dashboard: Explore placement rates, job roles, and salary ranges.
- Library Management Dashboard: Analyze book availability, borrowing activity, and popular categories.
When presenting a project, explain the problem, dataset, cleaning process, important measures, and insights. Include screenshots of your report and describe what someone can learn from it.
Conclusion
Creating an interactive Power BI dashboard is a practical way to develop data analysis and visualization skills. Start with a small dataset, clean it carefully, create useful charts, and add slicers to make your report interactive.
As you gain experience, explore more advanced features such as data relationships, DAX calculations, drill-through pages, and scheduled data refresh. Consistent practice will help you build stronger academic projects and prepare for entry-level data analyst opportunities.
Explore more learning resources and project guidance at ProjectDuniya.